FoldGO is a web tool for fold-change-specific functional enrichment analysis of transcriptome. FoldGO identifies gene ontology (GO) terms specifically enriched in sets of genes with a similar fold-changes in response to a stimulus
FoldGO is a web tool for fold-change-specific functional enrichment analysis of transcriptome. FoldGO identifies gene ontology (GO) terms specifically enriched in sets of genes with a similar fold-changes in response to a stimulus
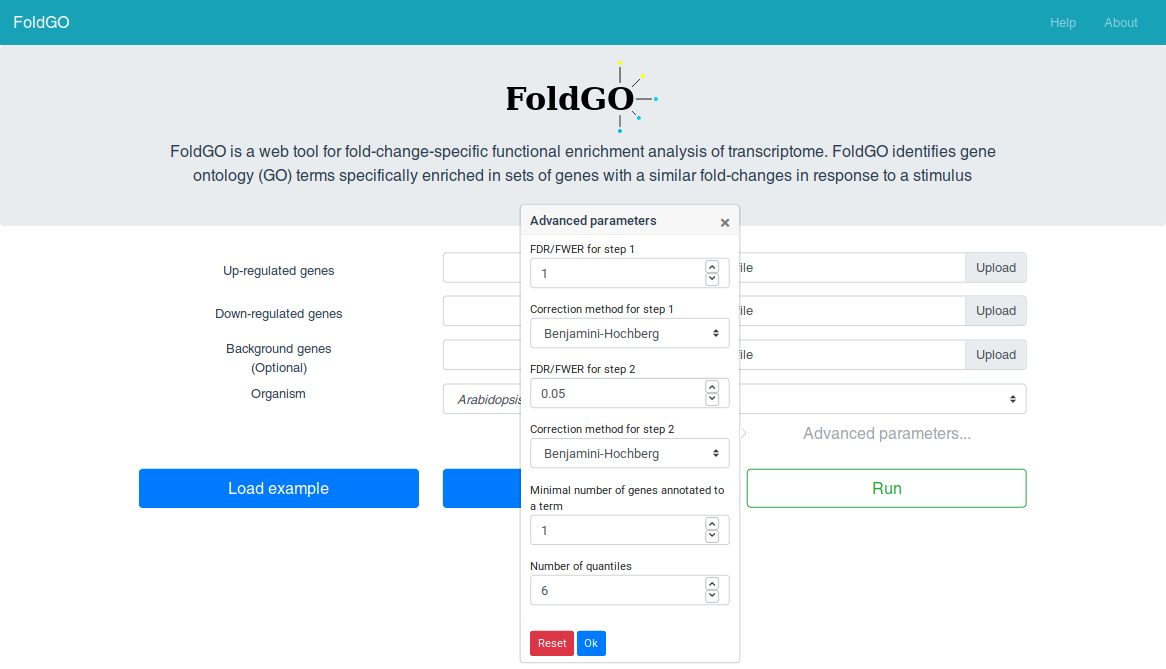
The FoldGO algorithm sorts the input data by the fold change values, divides it into quantiles and generates various combinations of neighboring quantiles (fold change intervals). At the first step FoldGO performs functional enrichment analysis for the differentially expressed genes set. Then, at the second step, FoldGO calculates the overrepresentation of GO terms (preselected at the first step) in genes responding within each fold-change interval compared to the whole list of differentially expressed genes. GO terms that showed significant enrichment for one or more fold-change intervals under multiple testing correction are considered as fold-change-specific. The method was previously described and validated in Omelyanchuk et al (2017). FoldGO is also available as an R package via Bioconductor (Wiebe, 2018).
Currently, FoldGO allows processing data for the following species: Arabidopsis thaliana (TAIR ID), Drosophila melanogaster (Entrez ID), Homo sapiens (Entrez ID, Ensembl ID), Mus musculus (Entrez ID), Сaenorhabditis elegans (Entrez ID). The species list is to be updated. Note that FoldGO supports a limited set of gene identifiers (listed above). If your data contains gene identifiers which are not supported by FoldGO, you can convert them using third-party tools, e.g. DAVID Gene ID Conversion Tool (How to convert gene ID's using DAVID).
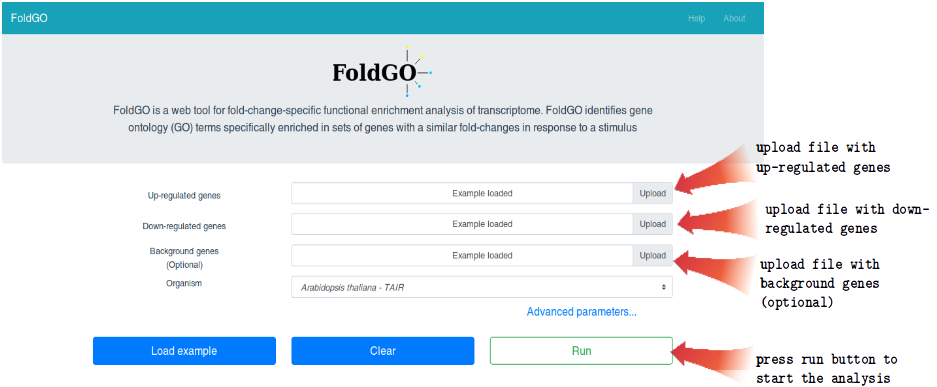
As input data FoldGO requires two tab-separated or comma-separated tables for up- and down-regulated genes in which the first column contains Gene IDs and the second one contains the corresponding log transformed fold-change values. If fold-change values in your data are not log transformed, they can be easily converted to such in MS Excel (or similar) (log transformation in MS Excel) or in R via the log2 function (log transformation in R).
| GeneID | logFC |
|---|---|
| AT3G65420 | 3.6 |
| AT1G78450 | 1.5 |
| AT2G66890 | 2.1 |
| ... | ... |
Additionally, the user can specify the background set of genes e.g. all genes which have corresponding probes on DNA microarray or gene universe from RNA-seq experiment. A background set of genes must be presented as a simple list of gene IDs:
| AT1G01120 |
| AT1G02520 |
| AT1G02730 |
| AT1G02850 |
| AT1G02900 |
| ... |
To analyze your data, load two files from your computer, separately for up- and down-regulated genes, then press the “run” button.
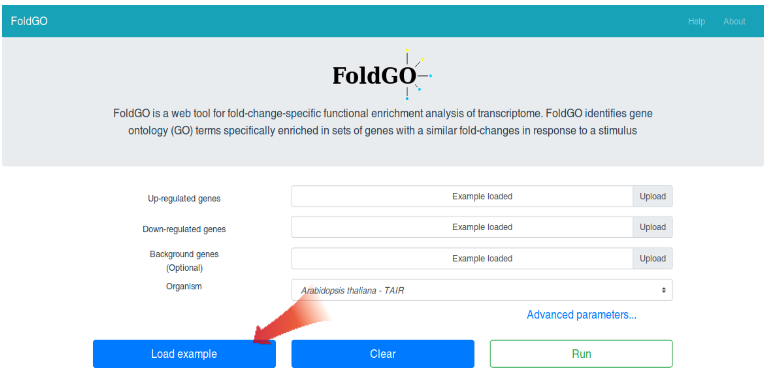
One can test FoldGO using an example data by pressing the “Load example” button.
Fold-change-specific GO Profile shows GO terms significantly associated with certain fold change intervals. Fold change intervals are depicted as yellow and blue boxes for up- and down-regulated genes, correspondingly. Numbers on the horizontal axis denote the boundary log fold change values for quantiles. The diagram presents only fold-change-specific GO terms. If the gene was associated fold-change-specifically with down-regulation but not fold-change-specifically with up-regulation (or vise versa) than the non-fold-change-specific interval (the default is 1-6) will be also shown.


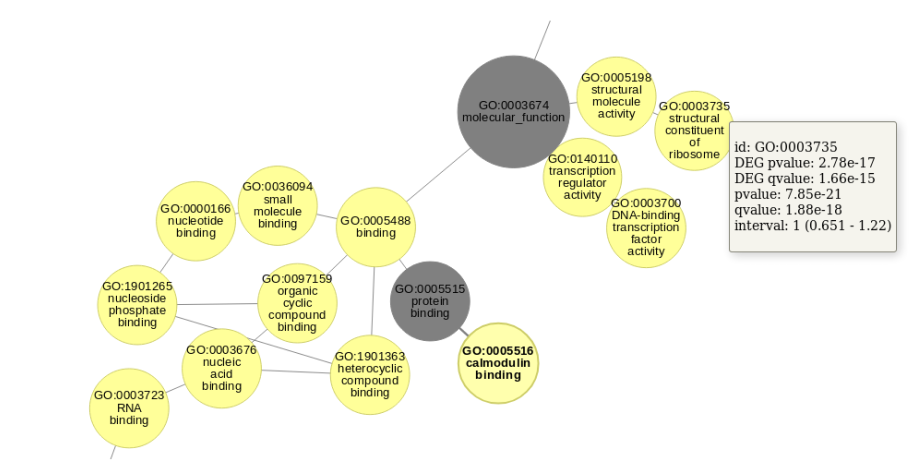
The Directed Acyclic Graph (DAG) is a most common way to visualize Gene Ontology data. Here graphs are tailored to represent fold-change-specific GO terms together with relations between GO terms. Note that if all ancestor GO terms of fold-change-specific GO term are not fold-change-specific they will not be shown. On the graph, fold-change-specific GO terms are shown as vertices of yellow color in case of up-regulation and blue in case of down-regulation. The graph is interactive so one can move vertices and look through additional information about the fold-change-specific GO terms by clicking on the corresponding vertices. Also you can zoom in/out the graph using the mouse wheel.
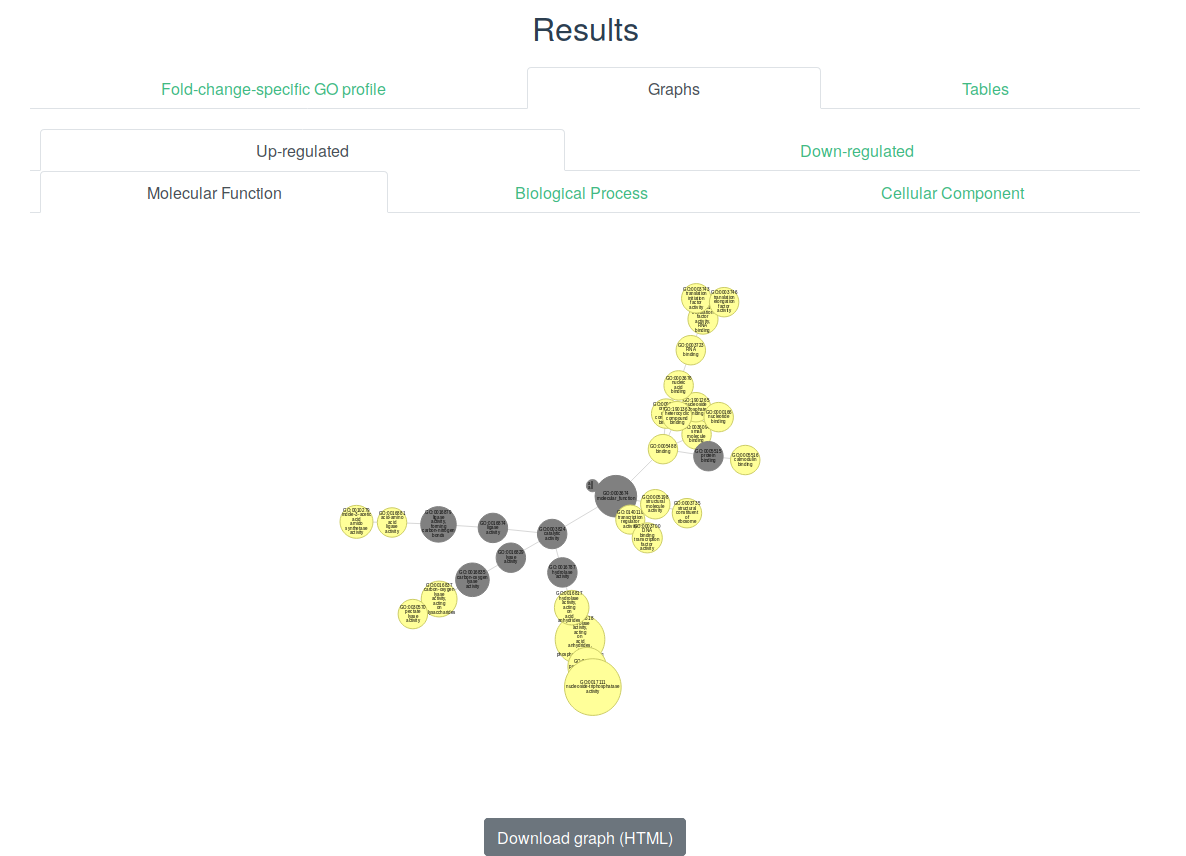
One can get more information about fold-change-specific GO term such as statistics and fold-change interval by just pointing the cursor on the corresponding vertex.
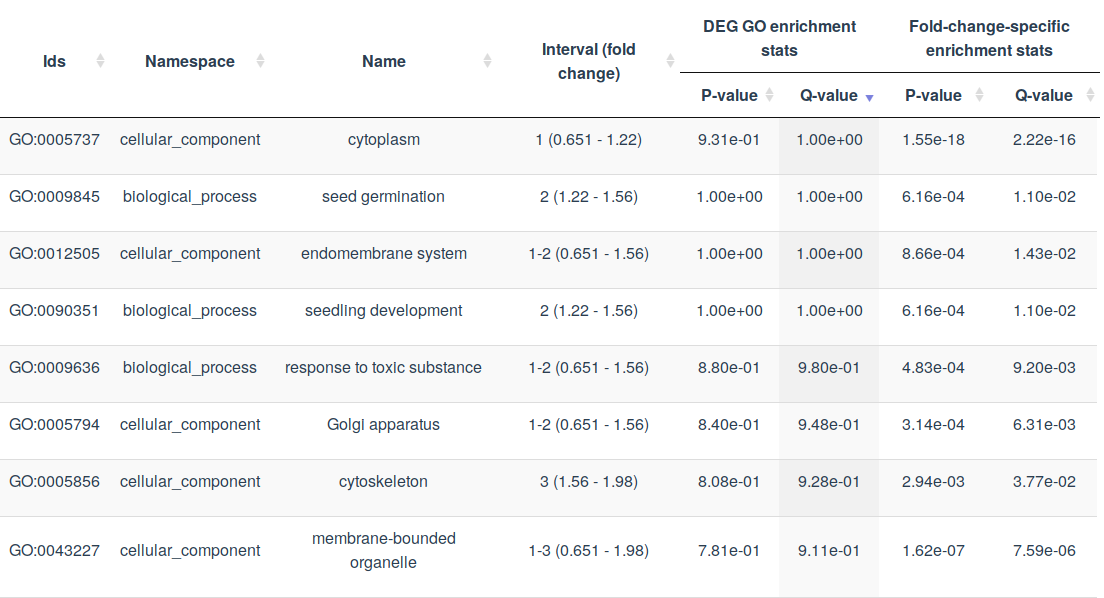
Tables contain the most complete information about GO terms under study. The FoldGO provides separate tables for fold-change-specific and not fold-change-specific GO terms and for up- and down-regulation. Columns contain the following information:
As an example dataset we use the data derived from RNA-seq experiment on phytohormone auxin treatment of Arabidopsis thaliana roots. The details on the experimental design and the conclusions about fold-change-specific analysis were described in (Omelyanchuk et al 2017).
Here are the links for the data used in the example:
up-regulated genes: link
down-regulated genes: link
background set of genes: link